Halloween is a time for tricks and treats, but did you know the holiday offers yet another opportunity to look into our consumer behavior through data? With 69.5 percent of Americans planning to celebrate this year, there are a surprising number of unique data points to unpack from costume trends to purchases — that give insight into the US population and even the health of our economy.
What Can Halloween Sales Data Tell Us?
Halloween is one of the more affordable end-of-year celebrations, so sales can provide insight into how retailers will perform during the critical holiday season that typically runs November to January. Strong sales are a good signal of a healthy economy. In 2017, Halloween spending was at a record high. This year, sales hover close to the same mark, with the planned consumer spending expected to reach $9 billion, according to The National Retail Federation’s annual survey.
The above graph from Statista shows that for the most part, Halloween spending has been trending upward since 2010, which is around the time that the Great Recession was ending in America. This increased spending trend coincides with an uptick in consumer confidence. It makes sense that the lowest charted expenditure occurred in 2009, when American consumers were wary of an unstable economy.
Interestingly enough, we can see that spending was higher in 2008, despite the country being in the middle of one of the worst recessions in history. Signs of economic crisis started in 2006, so why was spending on the up? A look at the 2008 financial crisis timeline shows that the global stock market didn’t collapse until October 6, 2008. In comparison, spending trends from the survey show that 31.3 percent and 43.3 percent of consumers make most of their Halloween-related purchases in September and within the first two weeks of October, respectively. Though there were signs of economic fallout at this time in 2008, consumers may not have fully realized that they were in a recession.
Today, consumer confidence is at an all-time high, and people are ready and willing to spend on Halloween festivities. The results of the survey reflect that confidence, finding that in 2018, the average amount someone will spend on their personal Halloween purchases will reach an all-time high of $86.79. So what are people buying? As you might predict, spending is pretty routine with consumers opening their wallets for costumes, candy, decorations, and greeting cards. This year, costumes are the biggest Halloween expenditure.
Costume Sales Data & Trends
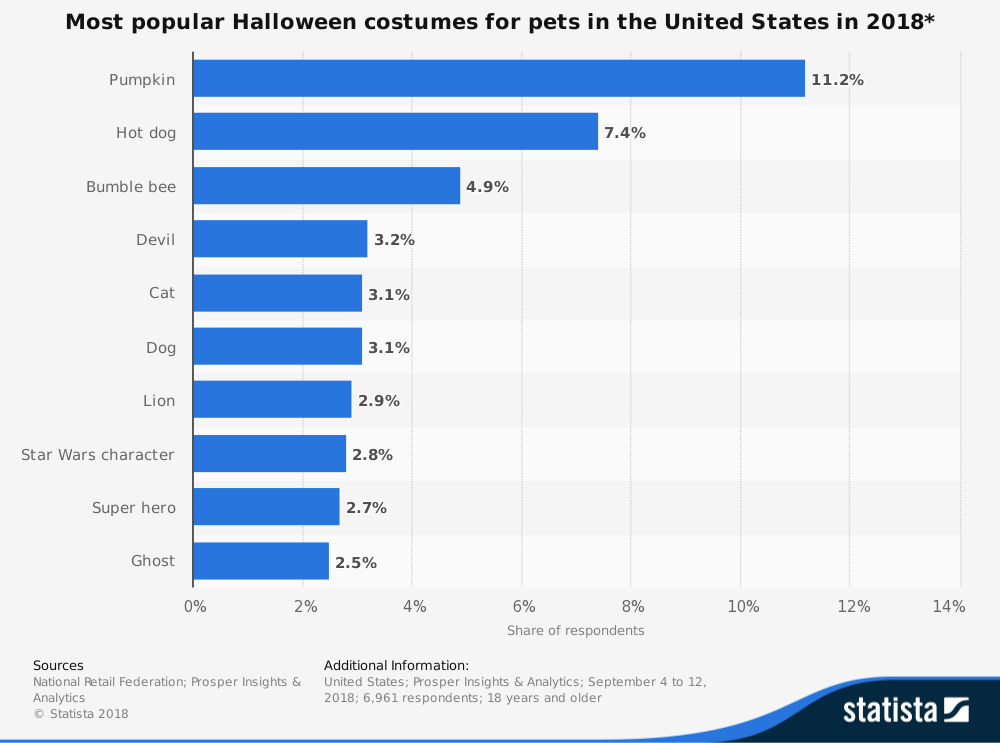
In fact, consumers are increasingly spending more on costumes for both adults and children. Even pets are getting in on the action. In 2017, consumers spent just under half a billion dollars on costumes for their pets alone. These retail trends are another reliable indicator of consumer demand, which drives our economic stability. As long as strong retail sales persist, it’s likely that the Federal Reserve will raise rates, supporting continued economic growth.
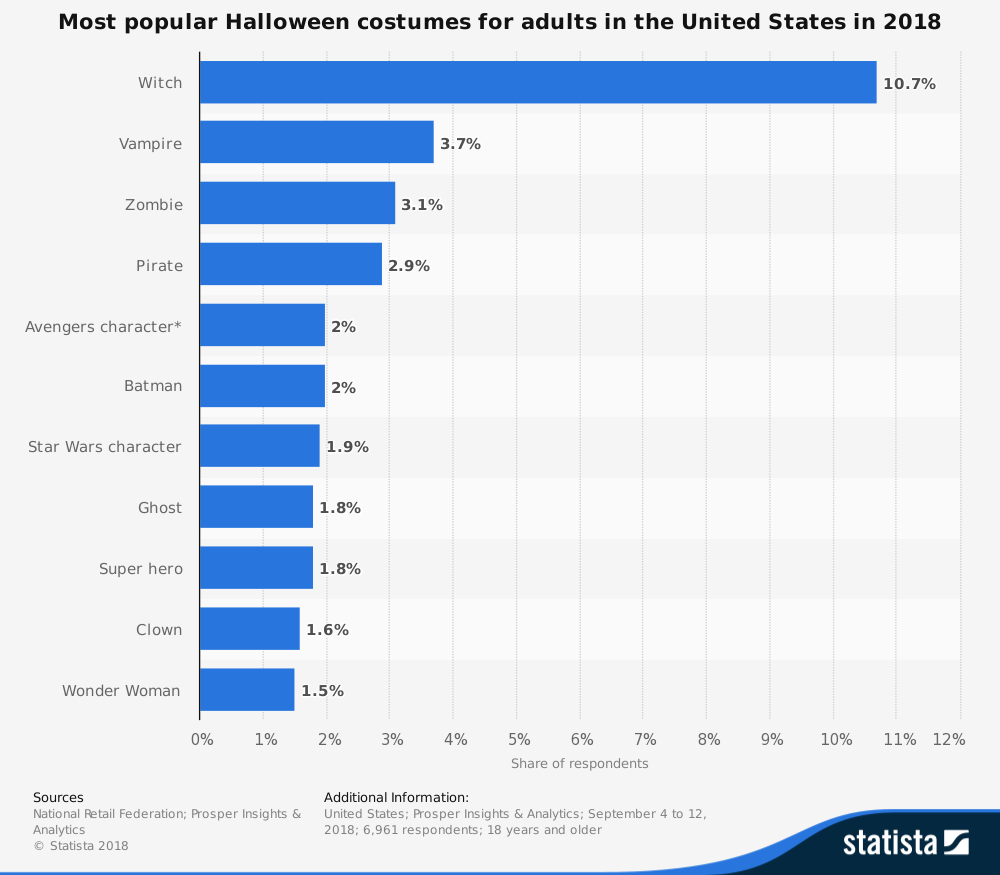
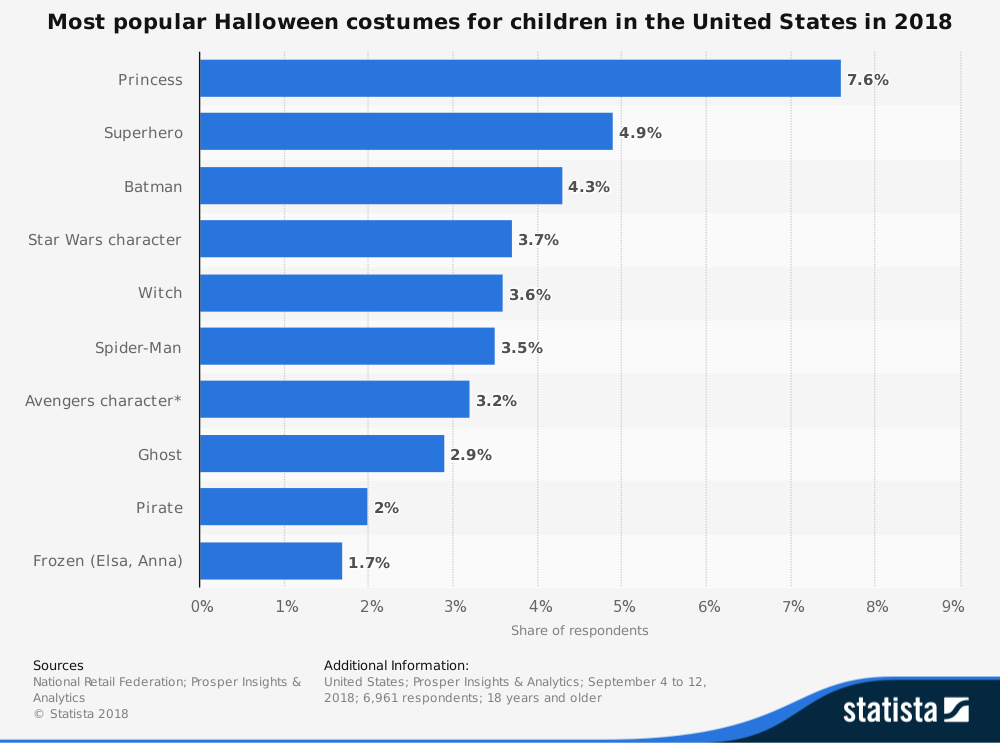
Halloween costumes are also a great reflection of the pop culture landscape. You can expect to see neighborhoods dotted with kids, adults, and their pets dressed as this year’s trending characters. Many of the top costumes, like witches, vampires, princesses, and superheroes are mainstays, but we can also see this year’s pop culture influences making the costume rounds. The Marvel and Star Wars franchises both released highly anticipated films in 2017 and 2018, and we can see the impact captured in costume choices for kids and adults. Owners are even dressing their pets up as Star Wars characters.
Data is all around us, and even something as lighthearted as Halloween can give us an opportunity to use data analytics to uncover valuable information. With just one holiday, we can get a glimpse into our economic landscape, consumer behavior and pop culture trends. With the proper training and tools, you can create your own analysis and visualization projects around holidays or hobbies that interest you.
To learn more about the booming field of analytics, download our free guide below.


Related Articles
Why Earn a Professional Doctoral Degree?
5 Tips to Get the Most out of Grad School
Is Earning a Graduate Certificate Worth It?